 |
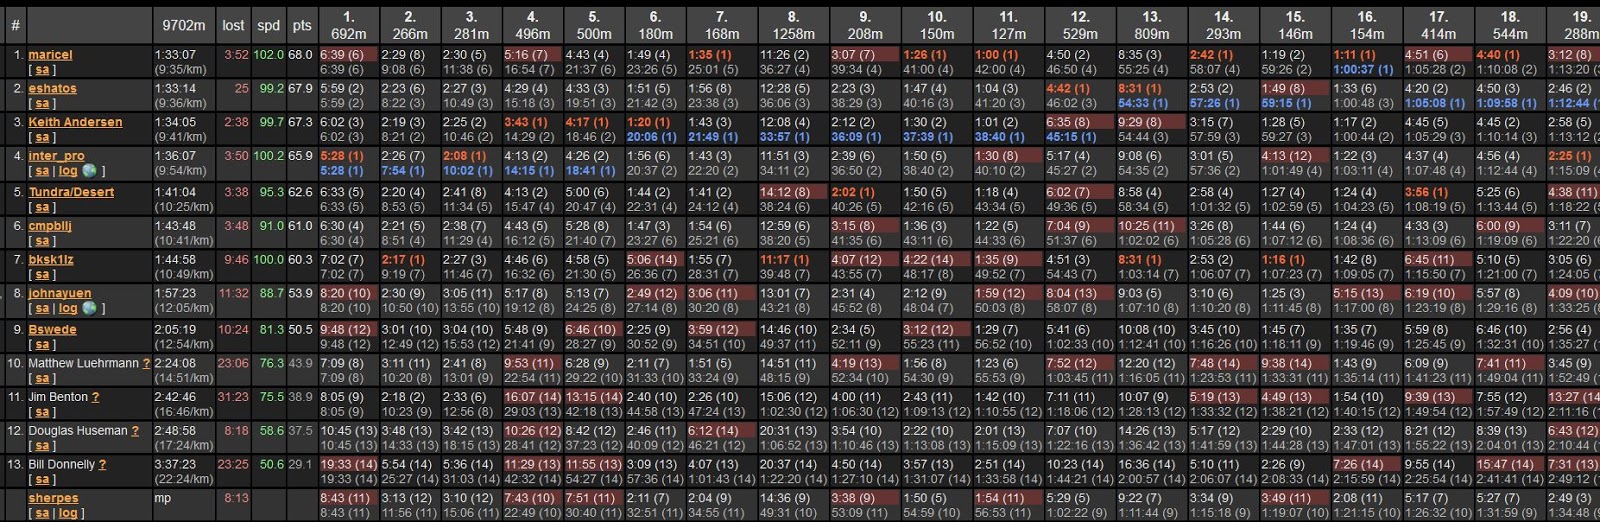
| I was slow (88.7% from the fastest), and I made a lot of errors (~11 min total). From the race result last year in AttackPoint. |
Before the age of computers, probably the only metric that assesses the performance of a cross-country orienteer is the finish time. To check if a person reaches all the checkpoints, punch card was used. Now, there is e-punch system to record the split between checkpoints (i.e. legs), and orienteers can compare each other on the performance of each leg.
Why Performance Statistics in Orienteering?
If a person wants to explore more on getting better in orienteering, he/she will eventually think, "how can I improve my time?" The classical wisdom of orienteering is that while speed is important for a win, if one gets lost while running fast, the time lost is usually more than running slow but gets the checkpoint location right. Thus, when orienteers want to get better time in orienteering, they needs to navigate to checkpoints as perfectly as possible (i.e. reduce error), while trying to maintain high running speed.
Unfortunately, merely having the split time does not clearly describe whether the loss of time is due to consistent low speed, or due to getting hopelessly lost in one leg but doing fine in the other legs. To find out this, some people try to separate split results into these two types, by comparing the results of other competitors and using some simple statistical methods. The advantage of separating these two types is that one can quantify how fast he/she is, and how many minutes he/she gets lost in a leg. To some people with science background (like me), simply saying "I am too slow" is not enough. Comparing to peers, how slow am I? Am I 10 or 20 minutes slower? For making error, instead of saying "I make a big error", I would rather want to say "I make a 10-minute error". With the statistics separated, I can also say whether I should focus more on making less mistakes, or I should focus on increase my average speed.
Thus, some orienteering result management tools can do further split analysis, mainly for separating individual errors from average speed. An example of the method is as follows:
Sakurai-Tori O-Lap analysis method
The method does not need GPS data, since split times of all competitors are enough for this method. However, it is always important to know the limitations for this simple method, since there are a list of assumptions in performing such calculations. You may read the link above to find out the details of the method, but I will mention the general approach of the method below.
Metric for Speed
After a race, an orienteer would probably like to know if mistakes are not made, how fast he/she can be. Such speed is best described by the speed relative to the top competitor's speed. The reason is that each leg has different physical and mental demand: short legs to test navigation, while long legs to test route choice; some legs may need to go uphills, while others go down.
When one can rate an orienteer's relative speed, a slow runner can evaluate whether his/her slower time is due to errors, or simply because he/she is slow on average.
It is important to state that speed does not simply mean how fast a person can run. It also includes consistent errors. e.g. if one orienteer always stops at every junction to decide which way to go, this counts as speed issue because he/she slows down by the same error all the time. Thus, if one finds his/her speed is much slower relative to the top performer, he/she should ask questions like:
1) Can I run faster?
2) Can I reduce the time stopped for reading maps?
Metric for Error
In contrast of speed, error here means abnormally lower speed due to inconsistent performance. This may be due to the following:
1) Getting lost in a leg
2) Choosing a less efficient route for a long leg
Before finding this error time, we need to know what the time will be when no errors are made. The challenge is that how the split times decide the ideal finish time, without a mistake. This should also take each person's relative speed into factor, since a slow person has slower time because of speed, and not necessarily because of error. In the cited method above, several assumptions were made for the calculation of ideal finish time for each person.
Once the ideal time is calculated, the error time is just the difference between the ideal time and the actual finish time. The error ratio can also be calculated by dividing the error time by the finish time.
The Tradeoff Between Speed and Error
It is incorrect to look and speed and error individually in orienteering, since these two interact with each other. When someone wants to improve the time to finish an orienteering course, he/she may want to run faster, but running faster will cause errors to be made more easily, since he/she is more likely to be tired and cannot think about the map clearly. It is stupid to just train to reduce the error ratio without looking at the speed, since he/she can walk the whole course and make no errors, but he/she cannot win!
I guess while the speed and error metrics do not exactly pinpoint what orienteering skills a person should focus on, these metrics provide a general direction. If I see my relative speed is too slow, I will try to run faster next time and see if my error ratio increases. If not, I should continue to increase the speed until I see my error ratio increases. Then, I can focus more on efficient map reading skills to see if I can spend less time thinking about map, allowing me to maintain the running speed.
Example: Comparing Route Choice
In a long leg, each orienteer may have a different route to get to the same checkpoint far away. At the end of the race, people may want to compare which route is the best. The two people with different routes may compare the split time to each other. However, we need to know if the two people have similar speeds before the comparison can actually be done. By looking at the relative speed statistics among orienteers, one can have a rough idea who runs similar speeds, whose split times can be directly compared. If a person wants to compare with the top runner's route, some handicapped time adjustment needs to be done before comparison.
One may also look at the error time. If someone feels that he/she does not get lost anywhere in the long leg, but get an error time, it is likely that the route choice is not optimal. He/she may even be able to estimate the time lost for that route choice.
Conclusion
Performance statistics in orienteering, inferred by split time, give us a rough idea on what area an orienteer should improve on. Combined with your personal experience during the race and the comparison of experiences with others, these statistics can roughly identify what skills should be improved, and quantify how good or bad (e.g. this is a 2-minute error). However, since these statistics are calculated based on a list of assumptions, it is important to not treat these data to be very accurate. If one has an ideal finish time of 20:00 in a sprint, while another person has an ideal finish time of 20:05, their speeds are likely to be not significantly different.
As a reminder, these statistics are just grades in your report card that give you direction for your future training. Reading these statistics alone does not make you a better orienteer. If you want to know how to train yourself, please ask other experienced orienteers.
No comments:
Post a Comment